Introduction - How a 1995 Study Transformed ACL Treatment Forever
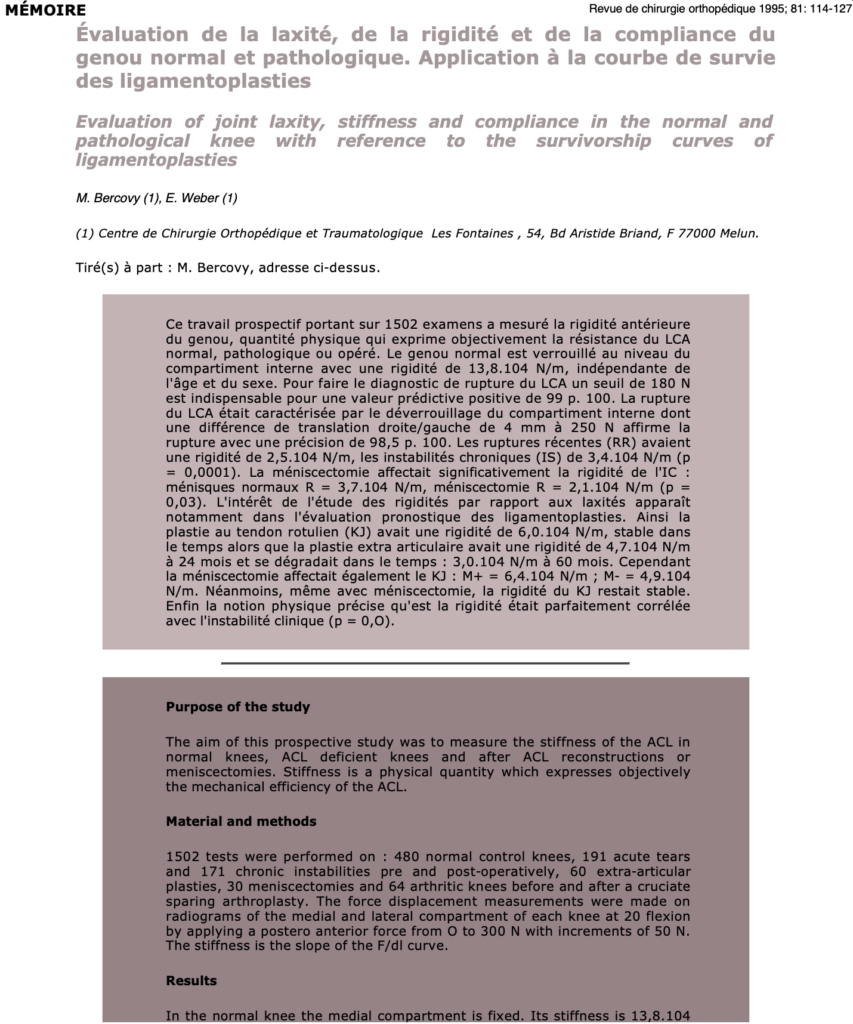
For decades, laxity has been the gold standard for evaluating anterior cruciate ligament (ACL) integrity, offering a straightforward measure of joint instability. However, research by Bercovy et al. (1995) revealed that laxity provides only a static snapshot of tibial displacement, failing to capture the ligament’s dynamic mechanical properties.
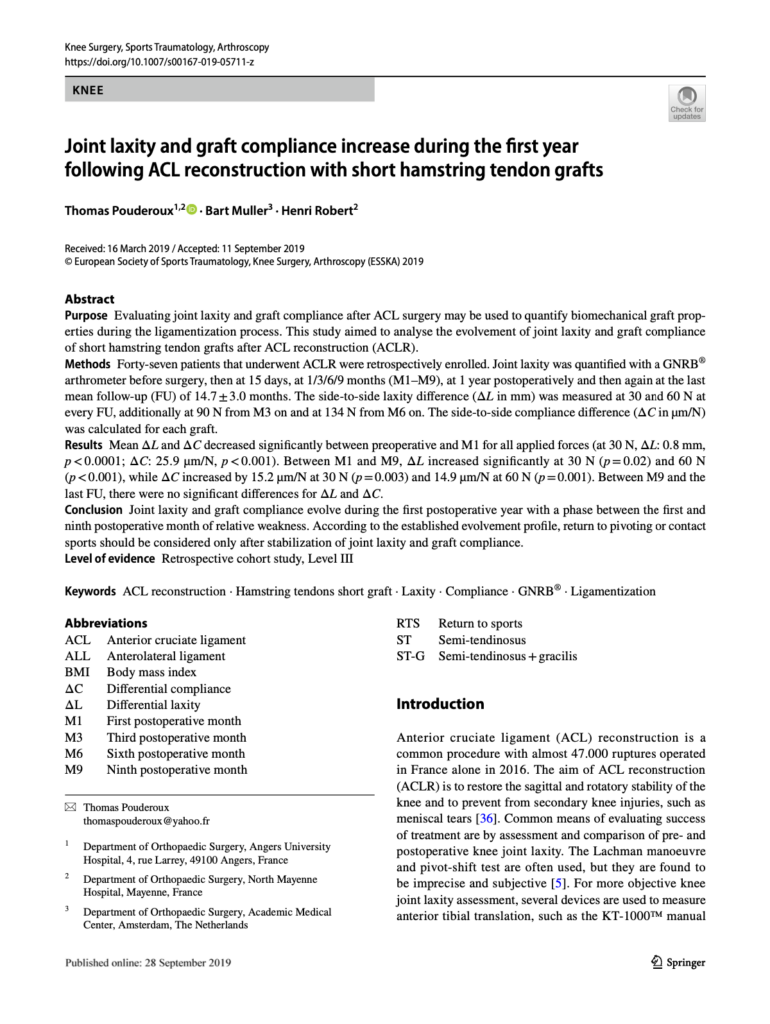
Modern studies, like Pouderoux et al. (2019), further demonstrate the limitations of relying solely on laxity for understanding ligament behavior during recovery. Nowadays, to address these shortcomings, ACL compliance/stiffness has emerged as a superior metric, offering a dynamic analysis of ligament behavior through force-displacement/force-rotation curves.
This article explores how compliance/stiffness surpasses laxity as the ideal parameter for ACL diagnostics and treatment, supported by cutting-edge research and advanced tools like GNRB® and Dyneelax®.
I. Laxity: The Established Gold Standard
Laxity refers to the anterior-posterior translation of the tibia relative to the femur, measured under applied force. It reflects the degree of joint motion and provides a practical, quantifiable metric for assessing ligament integrity. Instrumented devices like the KT-1000 or KT-2000 often standardize the force applied—commonly at thresholds such as 134 N (30 Pounds)—to ensure consistency and comparability. Its simplicity and widespread adoption in clinical and research settings have made laxity an indispensable tool in orthopaedic practice.
1.1 The Role of Laxity in ACL Diagnostics
Laxity has proven invaluable for diagnosing ACL injuries and monitoring recovery. Manual tests like the Lachman test, pivot shift test, and anterior drawer test are commonly used in clinical practice to identify abnormal tibial displacement indicative of ligament damage. To supplement these subjective assessments, instrumented devices such as the KT-1000 and KT-2000 provide more objective measurements of displacement under standardized forces, typically ranging from 89 N to 134 N.
This approach has been widely adopted due to its simplicity, efficiency, and historical success. For decades, laxity has helped surgeons detect ACL injuries, guide surgical decisions, and evaluate post-surgical outcomes. Studies like Bercovy et al. (1995) reinforced its value by standardizing displacement thresholds, offering clinicians a shared framework for interpreting knee joint stability.
1.2 The Strengths of Laxity
- Ease of Use: Laxity testing is non-invasive, relatively simple to perform, and requires minimal equipment (Lachman test, Pivot Shift Test, etc…), making it accessible in diverse clinical settings.
- Global Acceptance: Laxity has been used worldwide, creating a standardized reference point for comparing patients, treatments, and outcomes.
- Proven Utility: Decades of research and clinical use have demonstrated laxity’s effectiveness in detecting ACL injuries and monitoring changes over time.
II. The Gold Standard, But Not Without Flaws
Despite its long-standing role as the gold standard for ACL diagnostics, laxity has significant limitations that reduce its ability to fully capture ligament integrity and function. These limitations have been highlighted in both historical and modern studies, including Bercovy et al. (1995) and Pouderoux et al. (2019), which demonstrate the need for more comprehensive metrics.
2.1 Static Measurement
Laxity tests, whether manual or instrumented, focus solely on tibial displacement at one or two fixed force thresholds. This approach provides a snapshot of joint instability but fails to account for the dynamic behavior of the ligament under varying loads. As noted by Bercovy et al. (1995), such static measurements cannot capture changes in ligament stiffness, which are critical for understanding the mechanical health of the ACL. Pouderoux et al. (2019) further showed that joint laxity evolves significantly over time following ACL reconstruction, with both laxity and compliance/stiffness increasing during the ligamentization phase. Without the ability to track these dynamic changes, laxity measurements alone fail to provide the full picture.
2.2 Lack of Biomechanical Specificity
Although laxity quantifies tibial displacement, it does not reflect the ligament’s stiffness, elasticity, or ability to resist force—all critical indicators of mechanical health. For example, stiffness provides valuable insights into the structural integrity of the ligament and its capacity to stabilise the joint. Bercovy et al. (1995) demonstrated that compliance/stiffness, the inverse of stiffness, offers a more accurate and nuanced understanding of ligament behavior. Similarly, Pouderoux et al. (2019) emphasized that compliance/stiffness measurements are essential for understanding graft maturation and identifying potential weaknesses during rehabilitation. Without this bio-mechanical specificity, laxity measurements risk misinterpretation, particularly when comparing patients with different ligament or graft properties.
2.3 Operator Variability
Manual laxity tests, such as the Lachman test and pivot shift test, rely heavily on the examiner’s skill, experience, and subjective judgment. Factors such as the force applied, knee flexion angle, and the examiner’s ability to detect subtle tibial movements can influence the results. Even instrumented laxity devices like the KT-1000 or KT-2000 aim to reduce variability but remain limited in their ability to provide consistent, reproducible results across practitioners. Bercovy et al. (1995) highlighted that even when using standardized devices, laxity often fails to account for the full mechanical behavior of the ligament. Modern findings from Pouderoux et al. (2019) confirm that operator variability and reliance on static thresholds can overlook critical changes in graft compliance/stiffness during recovery.
While laxity remains a valuable diagnostic tool, its inability to capture the dynamic mechanical properties of the ACL has been well-documented by Bercovy et al. (1995) and reinforced by Pouderoux et al. (2019). These studies underscore the need for more advanced metrics like compliance, which can assess ligament behavior across a range of forces and provide deeper biomechanical insights.
III. Beyond Laxity: The Precision of Ligament Compliance
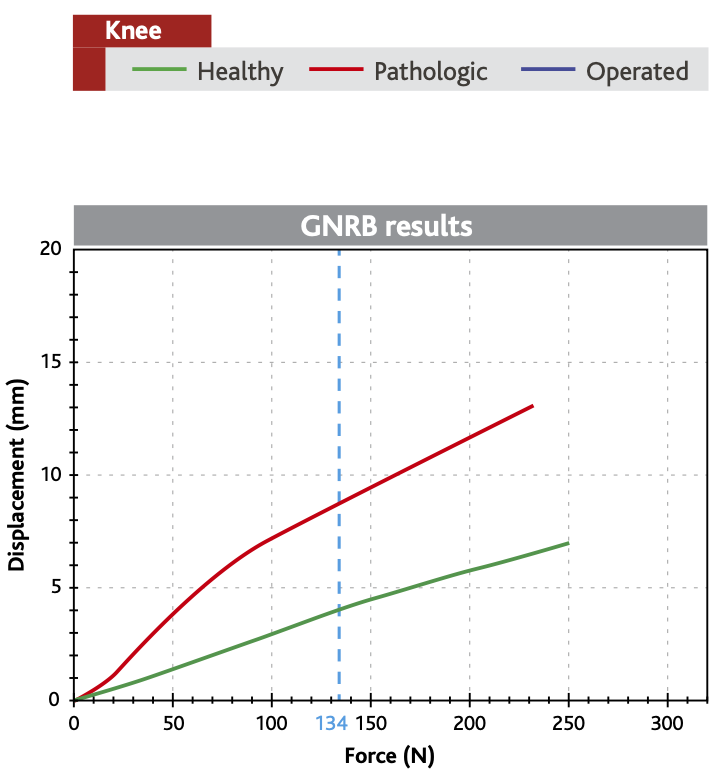
Compliance/stiffness measures how the ligament deforms in response to applied force, offering a dynamic and detailed analysis of its biomechanical behavior. Unlike laxity, which provides only a static measurement at specific force thresholds (such as 134 N, shown by the dashed blue line in the graph below: Graph 1), compliance/stiffness generate complete force-displacement curves. These curves capture how the ligaments respond across a range of forces, allowing clinicians to evaluate its stiffness, elasticity, and overall mechanical health.
In the graph:
- The green curve represents a healthy ACL, showing minimal displacement under increasing force. This indicates a stiff and stable ligament, capable of maintaining joint integrity.
- The red curve reflects a pathologic ACL, with significantly greater displacement at every level of applied force. This illustrates a reduction in stiffness and compromised ligament function.
On the other hand, static laxity, measured at the 134 N threshold, can only capture the displacement at a single point on the curve. For example, the healthy ligament (green curve) exhibits a displacement of approximately 4 mm at 134N, while the pathologic ligament (red curve) exceeds 8 mm at 134N. However, by analyzing the entire force-displacement curve, compliance/stiffness provides a more comprehensive view of ligament behavior, revealing dynamic properties that static laxity measurements cannot detect.
3.1 Evidence from Bercovy et al. (1995)
The diagnostic value of compliance/stiffness was first demonstrated in the landmark study by Bercovy et al. (1995). In this large-scale analysis of 1,502 knees, Bercovy and Weber compared compliance to laxity, revealing compliance’s ability to uncover crucial biomechanical differences between healthy and injured ACLs that laxity could not detect.
The study measured compliance as the amount of displacement per unit of force applied (measured in µm/N), emphasizing its ability to evaluate ligament stiffness, a key indicator of structural integrity. The findings were groundbreaking:
- Healthy ACLs exhibited a compliance of 7.2 µm/N, corresponding to a stiffness of 13.8 × 10⁴ N/m, which reflects a stable, well-functioning ligament.
- Injured ACLs (acute ruptures) showed a compliance of 40 µm/N, indicating a fivefold increase in displacement per force unit and a severe loss of stiffness.
3.3 Pouderoux et al. (2019): Tracking Ligamentization with Compliance
Building on the foundation laid by Bercovy et al. (1995), the study by Pouderoux et al. (2019) provided critical insights into the dynamic recovery of grafts after ACL reconstruction. By examining both joint laxity and compliance/stiffness over the course of a year, the researchers revealed a three-phase recovery pattern:
- Initial Phase: Immediately after surgery, graft stiffness is reduced due to the healing process, leading to increased compliance/stiffness and laxity.
- Transitional Phase: Between months 1 and 9, compliance increases as the graft undergoes the ligamentization process, during which the biological properties of the graft evolve toward those of a native ACL.
- Stabilization Phase: Around 9 to 12 months post-surgery, stiffness improves as the graft becomes more mechanically robust, signaling the end of the critical recovery period.
Pouderoux et al. (2019) highlighted the importance of compliance in tracking these changes, as it provides a dynamic and continuous view of graft behavior. Unlike laxity, which only offers static displacement values at fixed forces, compliance captures the evolving mechanical properties of the graft throughout the recovery timeline.
This ability to monitor the ligamentization process in real time is invaluable for tailoring rehabilitation protocols and determining when patients can safely return to high-demand activities like sports. By complementing laxity with compliance/stiffness analysis, clinicians can gain a more complete understanding of graft performance, ensuring better decision-making and improved patient outcomes.
IV. Why Compliance is the New Gold Standard in ACL Treatment
While laxity has been the foundation of ACL diagnostics, its reliance on static, single-point measurements limits its ability to reveal the ligament’s dynamic behavior. In contrast, compliance provides a comprehensive and multidimensional approach, offering insights into ligament function and stability that laxity cannot capture.
To understand this advantage, consider two scenarios where laxity measurements at 134 N—a common diagnostic threshold—might show similar values but mask critical differences in ligament behavior. You may either watch the video below or read further this article.
4.1 How Compliance Curves Expose Hidden Instabilities
Graphs 2 and 3 below illustrate this concept, highlighting how compliance/stiffness reveals nuances that static laxity measurements cannot. These graphs will help explain how compliance/stiffness uncovers functional instability by analyzing the entire force-displacement curve, not just a single point.
4.1.1 Scenario 1 : 1.5mm Laxity Differential with Parallel Slopes
Graph 2 demonstrates a stable ligament, as shown by the parallel slopes of the red curve (pathologic ligament) and the green curve (healthy ligament). Despite a small Δ134 = 1.5 mm laxity difference at 134 N, compliance/stiffness analysis confirms that the pathologic ligament behaves similarly to the healthy one under increasing loads.
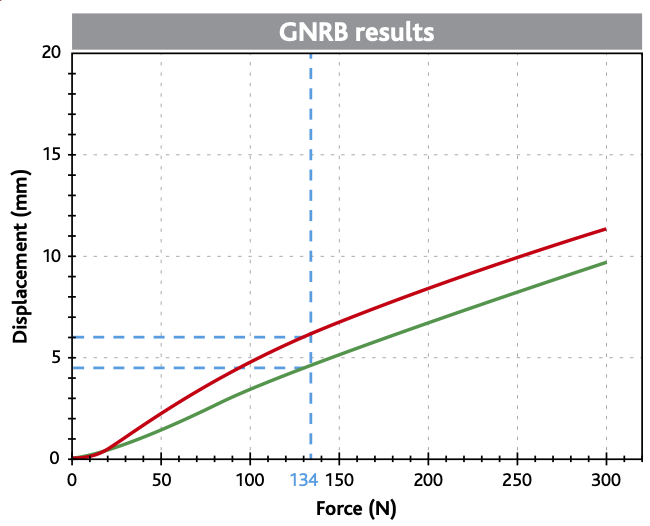
- Parallel slopes: The red and green curves remain parallel across the force-displacement spectrum, indicating that both ligaments have similar stiffness and can resist increasing loads effectively.
- Functional stability: The pathologic ligament shows no progressive instability, confirming its ability to maintain joint integrity even under higher forces.
- Confirmation through compliance: In this case, static laxity at 134 N aligns with the dynamic compliance/stiffness results, validating the ligament’s stability.
4.1.2 Scenario 2 : Also 1.5mm Laxity Differential but with Divergent Slopes
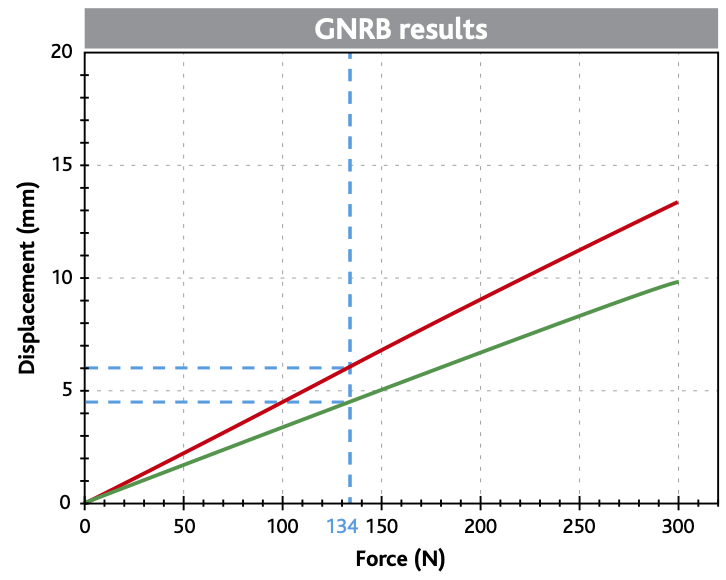
Graph 3, by contrast, highlights an unstable ligament, despite showing the same Δ134 = 1.5 mm laxity difference at 134 N. Unlike Graph 2, the red curve diverges from the green curve as force increases, revealing functional instability.
- Diverging slopes: The red curve steepens significantly compared to the green curve, indicating reduced stiffness and an inability to resist increasing loads.
- Progressive instability: As force increases, the ligament shows excessive displacement, suggesting mechanical deficiencies not captured by static laxity.
- Real-world implications: If forces were extended to 1000 N, as experienced during sports, the pathologic ligament would fail to provide adequate joint stability, putting the patient at a high risk of injury or graft failure.
These graphs clearly demonstrate compliance’s ability to uncover hidden functional differences that static laxity measurements cannot detect, making it an indispensable tool for modern ACL diagnostics.
4.2 Compliance’s Key Advantages
While laxity has historically been the cornerstone of ACL diagnostics, its static nature and reliance on single-point measurements limit its ability to capture the ligament’s dynamic and mechanical properties. In contrast, compliance/stiffness offers a more precise and multidimensional approach to ligament assessment, providing insights that go beyond what laxity alone can reveal.
4.2.1 Dynamic Assessment
The image below illustrates the clear advantage of compliance over static laxity by showcasing the differences in ligament behavior under varying forces. Laxity measures tibial displacement at a fixed force threshold, such as 134 N, providing only a static snapshot of ligament mechanics. Compliance/stiffness, in contrast, evaluates the entire force-displacement curve, reflecting not only ligament stiffness but also its elasticity and viscoelasticity—critical properties that influence how the ligament responds to progressively increasing loads over time.

This dynamic evaluation enables clinicians to detect hidden functional instabilities that static laxity cannot reveal. By analyzing the slope of the curves, compliance/stiffness uncovers subtle mechanical deficits, allowing for a more thorough and reliable assessment of ligament health. This is especially valuable in distinguishing between stable and unstable knees, even when their static laxity values appear similar. Furthermore, compliance/stiffness provides a comprehensive biomechanical profile, helping to differentiate between healthy, injured, and reconstructed ligaments, ensuring more precise and informed clinical decisions.
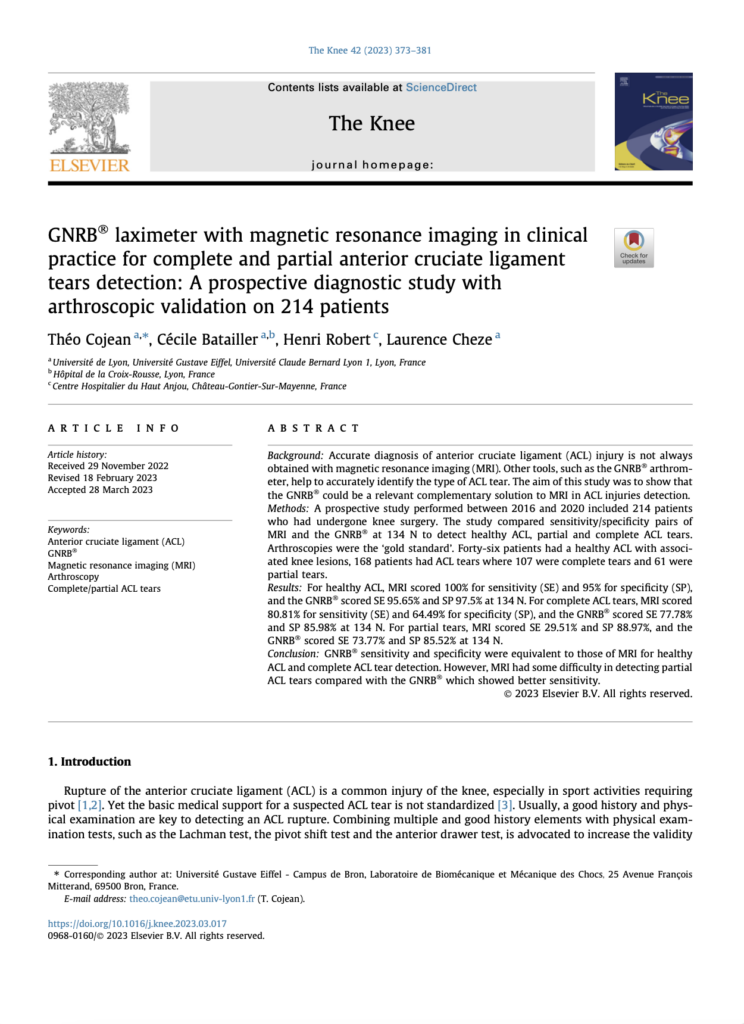
A key advantage of compliance/stiffness lies in its ability to detect partial ACL ruptures, a challenge where traditional methods like MRI often fall short. Cojean et al. (2023) demonstrated that compliance excels in identifying these injuries by providing functional assessments that reveal dynamic ligament instabilities invisible on static imaging. While MRI remains the gold standard for anatomical visualization, its static nature cannot capture the ligament’s behavior under load. Arthrometers like Dyneelax® bridge this gap by offering dynamic data that complements MRI findings, improving diagnostic accuracy and guiding treatment planning.
Recent advancements in compliance analysis, particularly with the inclusion of rotational analysis, have further expanded its scope. Guegan et al. (2024) introduced the ability to assess both rotational and translational stability using the Dyneelax® system, providing a multi-planar view of knee biomechanics. This dual analysis is critical for evaluating injuries involving structures like the anterolateral ligament (ALL) or planning advanced procedures such as lateral extra-articular tenodesis (LET). By coupling rotation and translation analysis, compliance offers a more nuanced understanding of knee stability, ensuring clinicians have the data needed to tailor interventions and optimize patient outcomes.
4.2.2 Predictive Power
Compliance/stiffness tracking over time provides surgeons with invaluable insights into the ligamentization process following ACL reconstruction. By monitoring compliance curves, clinicians can detect subtle changes in stiffness and behavior, offering early warnings of potential graft weaknesses or failures. For example, increasing compliance/stiffness during the early recovery phase may indicate insufficient graft integration, while gradual improvements in stiffness reflect successful healing. This ability to observe the graft’s mechanical evolution allows clinicians to make real-time adjustments to rehabilitation protocols and avoid complications.
The implications of this predictive capability extend to return-to-sport decisions, where accurate timing is critical for minimizing re-injury risk. Forelli et al. (2023) emphasized that compliance data, combined with sport-specific functional assessments, ensures that athletes regain not just anatomical stability but also functional readiness. By integrating compliance into post-operative monitoring, surgeons and physical therapists can design personalized rehabilitation protocols, optimizing recovery while reducing the likelihood of reinjury.
4.2.3 Operator Independence
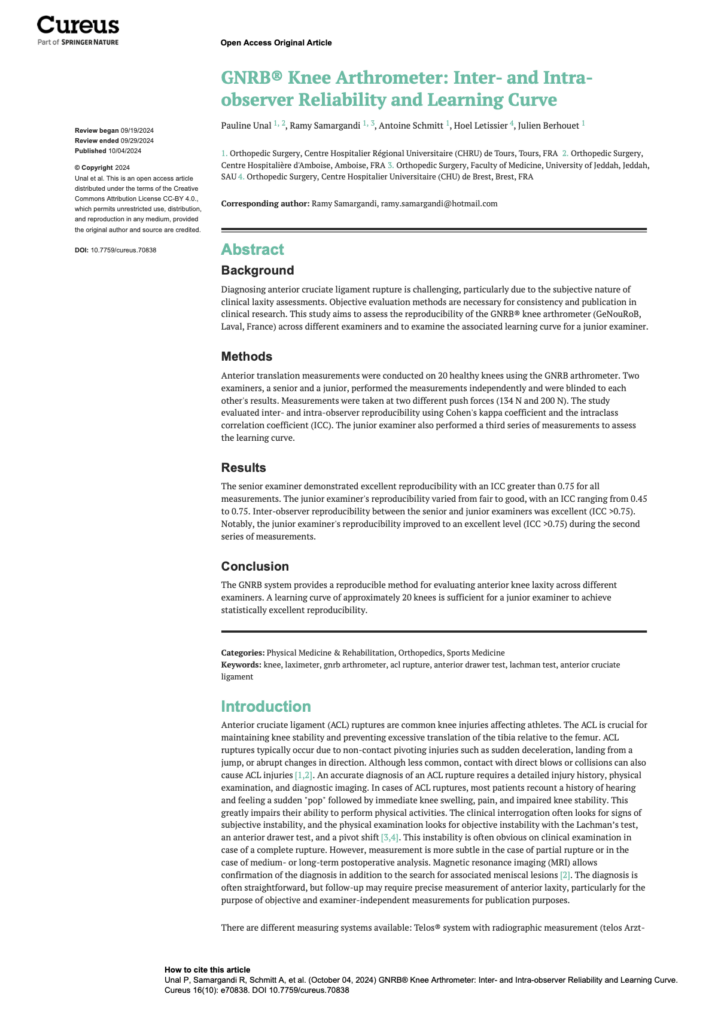
One of the most significant drawbacks of manual laxity tests is their reliance on the examiner’s skill and experience, which can lead to variability in results. Even instrumented laxity devices, while an improvement, are limited by operator-dependent factors. Robotic arthrometers, such as the GNRB® and Dyneelax®, resolve these challenges by providing fully automated, reproducible compliance measurements. These devices deliver consistent, high-precision results that are independent of examiner variability.
Studies like Unal et al. (2024) and Klouche et al. (2015) validated the reliability and reproducibility of robotic arthrometers, highlighting their ability to standardize assessments across different settings and clinicians. This automation and standardization not only improve diagnostic accuracy but also enhance their value in research, where consistent measurements are crucial for comparing outcomes across studies. By eliminating human bias, compliance/stiffness measurements become a truly objective and reliable metric, setting a new standard for knee ligament evaluation.
V. Modern Tools for Measuring Compliance
5.1 GNRB®: Precision in Linear Compliance
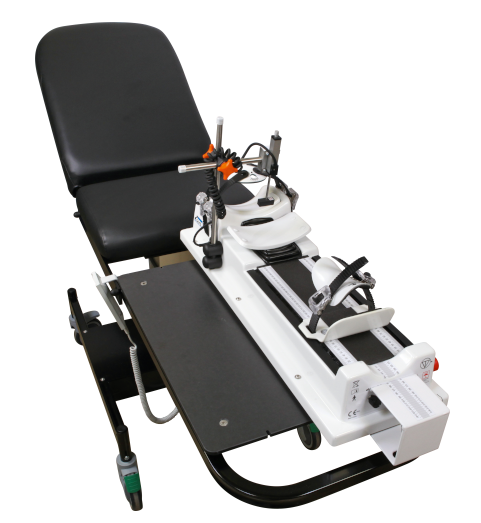
The GNRB® arthrometer uses a motorized system to apply incremental forces to the tibia, generating detailed force-displacement curves that reflect both compliance/stiffness and laxity. This dual measurement approach ensures a comprehensive evaluation of ACL function. Robert et al. (2009) demonstrated that GNRB® achieves superior sensitivity and reproducibility compared to manual devices like the KT-1000.
The study highlighted that the GNRB® detected partial ACL tears with 80% sensitivity and 87% specificity at 134 N, underscoring its diagnostic accuracy in cases where traditional methods struggle.
Klouche et al. (2015) further validated the GNRB® by comparing its performance across varying pressure loads, with 200 N proving highly effective for detecting complete ACL ruptures. The GNRB® is also independent of operator skill, enhancing its reliability for widespread clinical use.
5.2 Dyneelax®: Multi-Dimensional Analysis
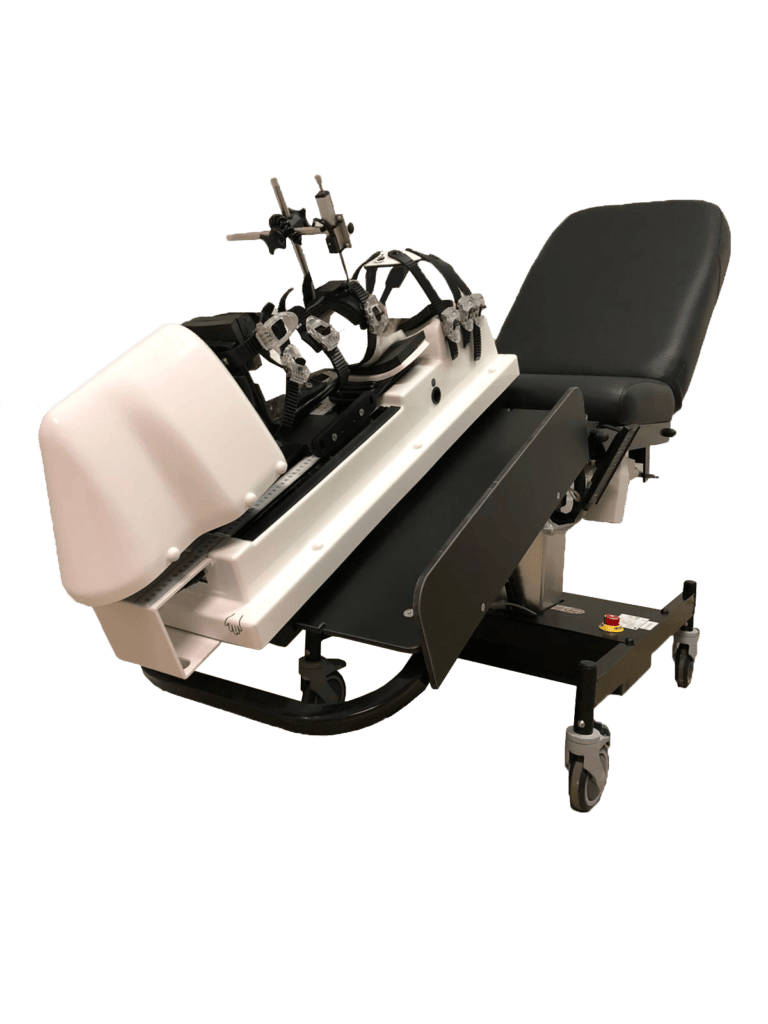
The Dyneelax® arthrometer builds upon the GNRB® by incorporating rotational stability analysis alongside translational compliance/stiffness measurements, addressing the multi-planar biomechanics of the knee. This unique capability is critical for evaluating both rotational and translational stability, making it an invaluable tool for diagnosing complex ligament injuries and planning surgeries.
Guegan et al. (2024) highlighted Dyneelax’s ability to analyze medial plane structures, optimizing surgical planning for procedures such as ACL + LET or ACL + ALL reconstructions. Additionally, Cojean et al. (2023) validated Dyneelax’s sensitivity, repeatability, and reproducibility, proving it capable of detecting partial ACL ruptures with functional insights that complement MRI findings.
In a significant advancement, Nascimento et al. (2024) confirmed Dyneelax’s reliability and feasibility in human testing. Their study demonstrated excellent intrarater reliability (ICC 0.91–0.96) for both translational and rotational metrics, solidifying its use as a gold-standard device for clinical and research applications. By integrating compliance with multi-dimensional stability assessments, Dyneelax® sets a new standard for evaluating ACL integrity.
VI. Clinical Applications of Compliance
6.1 Enhanced Diagnostics
Compliance excels in detecting partial ACL tears, which are often missed by traditional laxity tests and static imaging methods like MRI. Cojean et al. (2023) found that the GNRB® achieved a sensitivity of 73.77% for partial tears, significantly outperforming MRI, which demonstrated only 29.51% sensitivity. This remarkable capability highlights compliance’s ability to reveal functional instabilities in ligaments that appear anatomically intact on MRI. Early diagnosis through compliance/stiffness not only enables timely intervention but also ensures that treatment strategies are tailored to the specific mechanical deficits of the ligament, improving patient outcomes.
6.2 Surgical Decision-Making
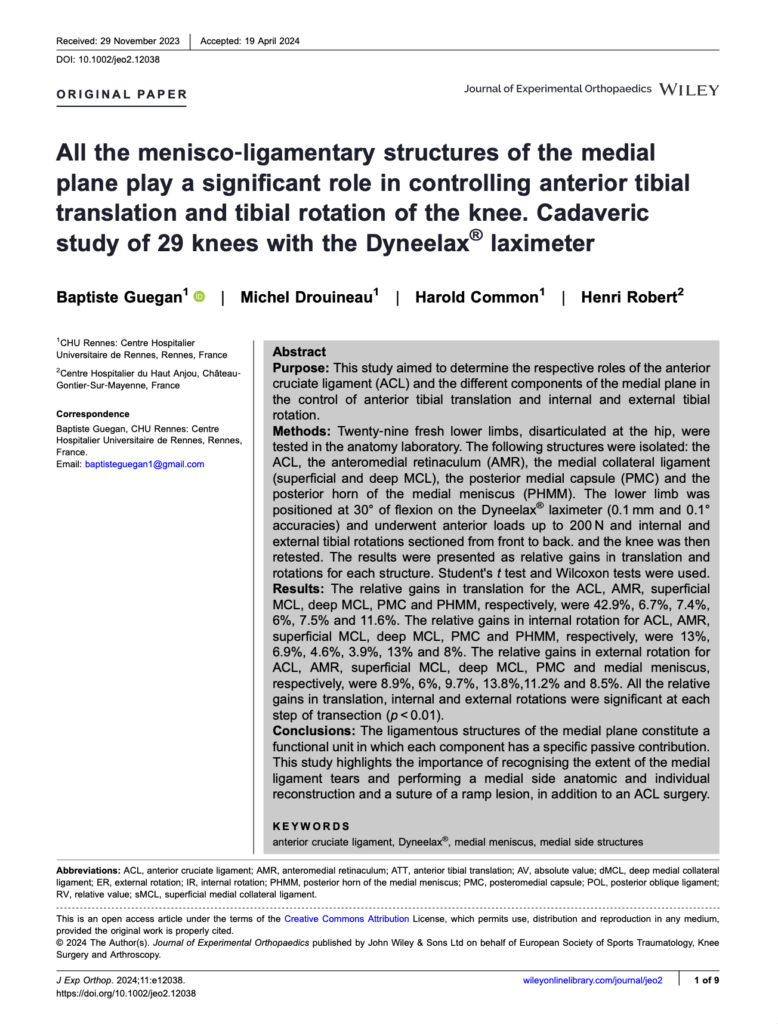
Compliance analysis provides critical biomechanical insights that help surgeons tailor their surgical strategies to each patient’s unique needs. Guegan et al. (2024) demonstrated that compliance/stiffness curves can quantify the contributions of medial plane structures—such as the posterior oblique ligament and the medial collateral ligament—to overall knee stability.
These insights are invaluable for selecting the most effective reconstruction techniques, particularly in complex procedures like ACL + LET or ACL + ALL reconstructions. By revealing both translational and rotational instabilities, compliance/stiffness empowers surgeons to address multi-planar deficits, ensuring that interventions restore stability comprehensively.
6.3 Post-Surgical Monitoring
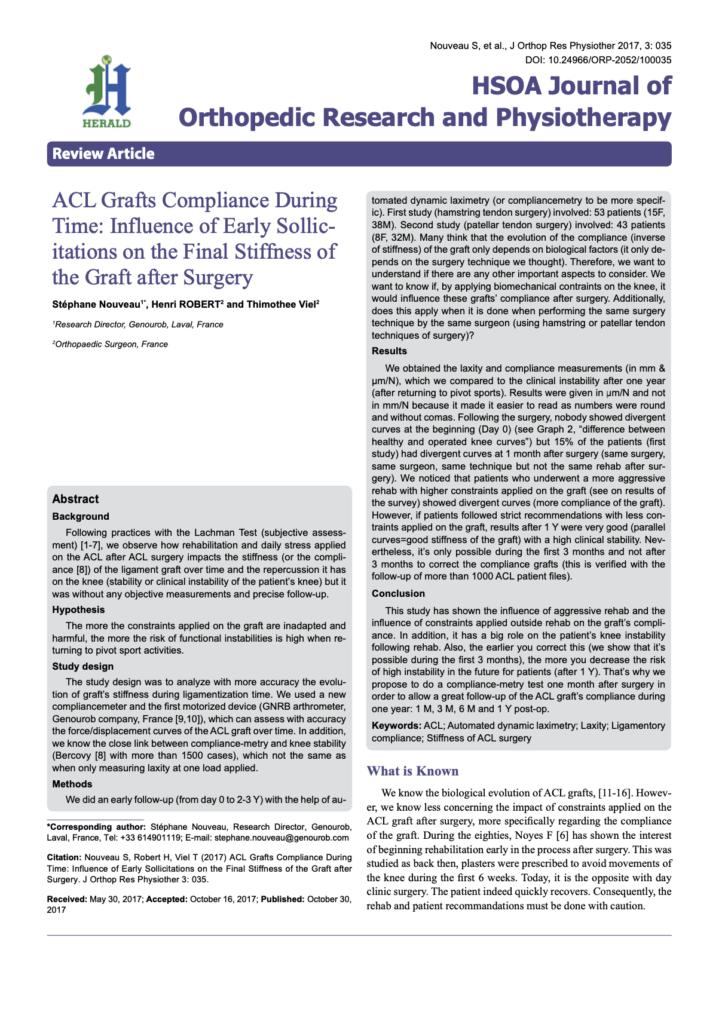
Compliance/stiffness testing is a cornerstone of post-surgical monitoring, providing clinicians with the tools to evaluate graft maturation and detect early signs of failure. During rehabilitation, compliance curves track the progression of the ligamentization process, where the graft gradually adapts to its new biomechanical role. Nouveau et al. (2017) and Pouderoux et al. (2019) emphasized the importance of compliance analysis during this phase, showing that compliance increases initially but stabilizes as the graft strengthens.
Deviations from these expected compliance patterns—such as excessive stiffness or persistent instability—serve as early warning signs of graft failure or suboptimal healing. This allows clinicians to adjust rehabilitation protocols in real-time, avoiding complications and optimizing outcomes. By tracking compliance over time, clinicians can ensure that recovery progresses as expected, paving the way for a safe and effective return to sport.
Conclusion
The integration of compliance into ACL diagnostics and treatment represents a breakthrough in modern orthopedics. By providing a dynamic and comprehensive assessment of ligament behavior, compliance/stiffness addresses the limitations of static laxity measurements, offering a superior metric for diagnosing injuries, planning surgeries, and guiding rehabilitation.
Through innovative tools like the GNRB® and Dyneelax®, compliance/stiffness is now accessible to clinicians worldwide, making it possible to deliver personalized, evidence-based care that improves patient outcomes. These patented technologies not only ensure accuracy and reproducibility but also set the stage for compliance to become the gold standard in ACL evaluation.
As the field of orthopaedics continues to evolve, the transition from laxity to compliance signifies a paradigm shift that benefits both practitioners and patients. With its ability to uncover hidden instabilities, monitor graft recovery, and guide return-to-sport decisions, compliance offers a mechanically relevant and clinically actionable parameter that meets the demands of modern healthcare.
At Genourob, we are proud to lead this transformation, bridging the gap between research and practice to ensure that compliance becomes an indispensable part of ACL care. Together, we can redefine how ACL injuries are diagnosed, treated, and managed—delivering better outcomes and a brighter future for orthopedic patients around the world.

