Study Title: Relationship Between Quantitative MRI UTE-T2* of ACL Autografts and BMI-Normalized Knee Laxity Within the First Year After ACL Reconstruction
Authors: Alonso Figueroa, Tomasz Bugajski, Dillon Humpal, Manickam Kumaravel, Walter Lowe, Payam Zandiyeh
Journal: The American Journal of Sports Medicine (AJSM)
Publication Date: 2025
DOI: 10.1177/03635465251368393
Institution: University of Texas Health Science Center, Houston, Texas, USA
Overview
After ACL reconstruction (ACLR), the autograft goes through a complex ligamentization process: early necrosis and remodeling, then progressive re-organization of collagen and water content, and finally maturation.
This new prospective case series (Level of Evidence 4) in AJSM combines:
Quantitative ultrashort echo time T2* MRI (UTE-T2*) of the ACL graft, and
BMI-normalized anterior knee laxity measured with the GNRB® arthrometer at 200 N,
to track how graft structure and mechanical stability co-evolve over the first postoperative year.
The main messages:
UTE-T2* decay coefficients of the graft peak at 6 months and then decrease by 12 months – a pattern that matches the classic 3-phase ligamentization model.
BMI-normalized GNRB® laxity tends to decrease between 6 and 12 months, but the operated knee remains laxer than the contralateral side overall.
By 12 months, short-component UTE-T2* (T2s*) shows a strong positive correlation with GNRB® laxity, making it a particularly sensitive imaging biomarker of graft mechanical integrity.
Together, these findings support the idea that advanced quantitative MRI and robotic arthrometry are complementary tools to monitor graft remodeling and guide rehabilitation/return-to-sport decisions.
Methods in brief
Prospective longitudinal case series (Level 4)
Follow-up at:
- 1 month and 12 months: quantitative UTE-T2* MRI of both knees
- 6 months and 12 months: bilateral instrumented anterior knee laxity using the GNRB® (200 N)
Imaging
3T MRI scanner, ultrashort echo time T2* sequence of the ACL region.
UTE-T2* decay coefficients computed using:
- Monoexponential model → T2m*
- Biexponential model → short (T2s*) and long (T2l*) components
Decay coefficients were normalized to BMI to reduce confounding from body habitus on tissue properties.
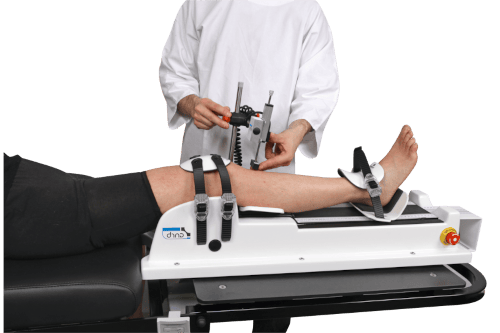
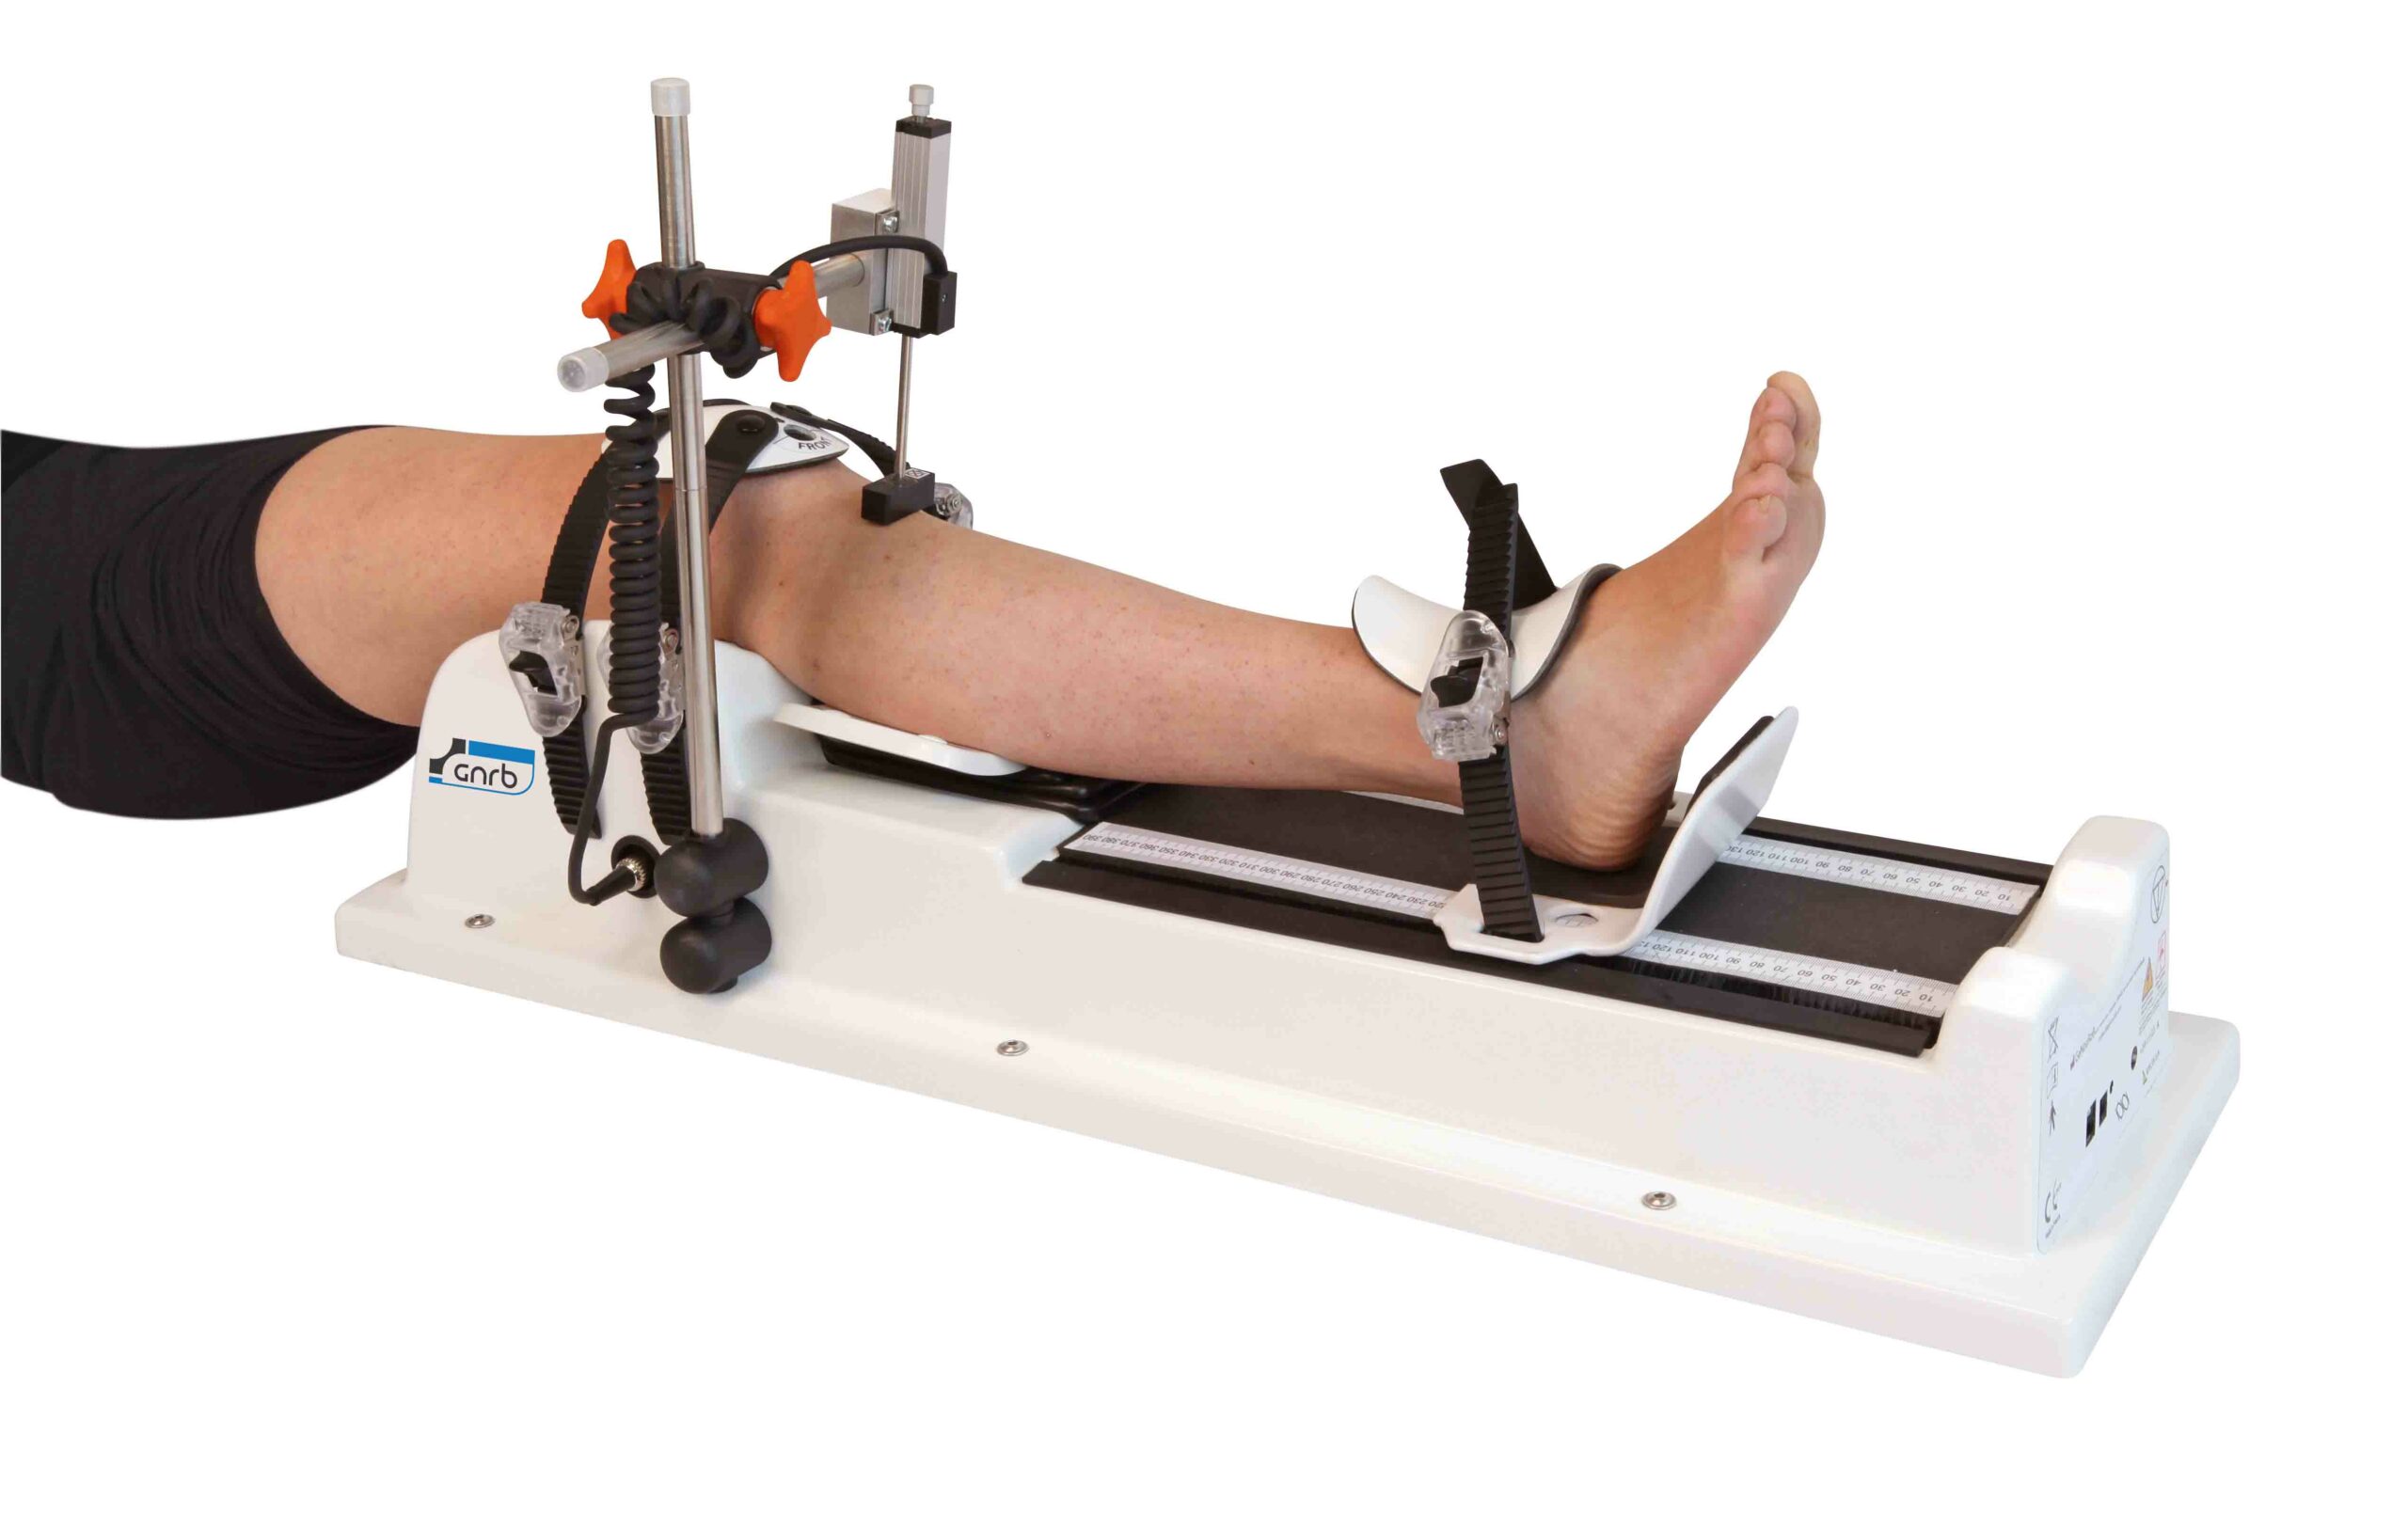
Laxity measurement
Device: GNRB® (Genourob), chosen for its:
Higher accuracy, objectivity, reliability and reproducibility compared with KT-1000/2000,
Standardized patient positioning and controlled anterior force application.
Protocol
- Patient supine, arms by the side
- Knee at ~20° flexion, patella facing anteriorly, leg secured with strap
- Standardized patellar fixation force around 60–65 N
- Anterior tibial load ramped to 200 N, with tibial translation recorded every 5 N to 0.1 mm precision
- Three trials per limb; mean value used
Laxity defined as difference in tibial position between 0 N and 200 N, then normalized to BMI (Laxity_norm).
Statistics
A priori power calculation suggested a minimum sample size of 27 for repeated-measures analysis.
Linear mixed models for longitudinal changes in UTE-T2* and laxity.
Pearson correlations to explore relationships between laxity and each UTE-T2* coefficient at 6 and 12 months.
Participants
31 patients after primary ACL reconstruction
Graft types:
- Quadriceps tendon autograft (QuadT)
- Bone–patellar tendon–bone (BTB) autograft
Age: late teens to early adulthood (mean around 18–20 years at surgery; active population)
All underwent standardized rehabilitation.
The contralateral ACL was scanned at 1 and 12 months as an internal control to rule out parallel changes in the uninvolved knee.
Key Results
1. UTE-T2* coefficients peak at 6 months (index limb)
For the reconstructed ACL:
T2m* (monoexponential coefficient):
Increased from 1 to 6 months (Δ = +0.092; P = .008)
Decreased from 6 to 12 months (Δ = –0.079; P = .021)
Overall pattern: +36.1% rise to 6 months, then 23.1% decline to 12 months.
T2s* (short component) and T2l* (long component):
Showed a similar “up then down” trajectory:
T2s*: +15.4% from 1 to 6 months, then –6.9% from 6 to 12 months
T2l*: +19.7% from 1 to 6 months, then –3.4% from 6 to 12 months
These changes did not all reach formal statistical significance but clearly followed the same temporal pattern.
Importantly, no significant changes were detected in the contralateral ACL’s UTE-T2*, suggesting that the observed signal evolution is specific to the graft and not a global effect.
2. BMI-normalized GNRB® laxity: trend toward improvement, but operated limb remains laxer
No statistically significant longitudinal change in BMI-normalized laxity over time for either limb:
Index limb: Δ = –0.044; P = .053
Contralateral limb: Δ = –0.022; P = .219
However, the index limb showed a clear trend toward decreased (improved) laxity between 6 and 12 months.
Across timepoints, overall laxity remained significantly greater in the index limb compared with the contralateral side (Δ = –0.033; P = .046).
In simple terms: the reconstructed knee gradually became more stable, but still did not fully match the contralateral knee at 1 year, even after BMI normalization.
3. Correlations between UTE-T2* and laxity
All correlations were positive: higher UTE-T2* values were associated with greater BMI-normalized laxity.
At 6 months:
T2s* (short component) showed a weak-to-moderate correlation with laxity:
R = 0.285; P = .025
T2m* and T2l* were not significantly correlated at this timepoint.
At 12 months:
Correlations became much stronger:
T2s*: R = 0.669; P < .001
T2m*: R = 0.532; P < .01
T2l*: R = 0.354; P = .034
This means that by 1 year:
The MRI signature of the graft (especially T2s*) aligns closely with objective anterior knee laxity measured by the GNRB®.
T2s* is particularly important because it is thought to reflect bound water and collagen organization more directly than the long-component signal.
Bottom line
Within the first year after ACL reconstruction:
Graft UTE-T2* MRI coefficients peak at 6 months and decline by 12 months, echoing the three-stage ligamentization model.
BMI-normalized GNRB® laxity tends to improve between 6 and 12 months, but the reconstructed knee remains slightly more lax than the contralateral side.
By 12 months, short-component UTE-T2* (T2s*) shows a strong correlation with robotic laxity, reinforcing its role as a critical biomarker of graft integrity.
For clinicians and researchers, the study underscores the value of combining advanced quantitative MRI with robotic knee arthrometry (GNRB® today, extended by Dyneelax® for combined translational and rotational assessment) to obtain a comprehensive picture of ACL graft health during rehabilitation and before return to pivoting sports.